| |
This activity asks students to undertake
three simple practicals, and collect data
from which they can identify ‘laws.’ Students
are supported to develop an explanation
of the general pattern of exponential
decay in terms of a negative feedback
cycle.
|
|
| Overview of the activity |
| |
| This session is a laboratory-based
session, where students are asked to identify patterns
(laws) in three different physical contexts: cooling,
water flow, capacitor discharge. |
| |
| Rationale of the
activity |
| |
A key purpose
of this session is to introduce another important
‘nature of science’ (see chapter 4) idea, that of
the ‘law’. The three activities have been selected
because they offer the potential for recognising
similar patterns (i.e. the exponential decay curve),
and for linking with some abstract theory (about
feedback cycles) that could offer an explanation
of the patterns. The activities are set-up using
the well-known POE – predict, observe, explain –
approach, where students are encouraged to engage
with understanding a phenomenon by initially making
a prediction, which they then test against observations.
Part of the logic of this approach is that students
making false predictions will be motivated to find
out why their prediction (and so presumably their
initial assumptions) were wrong. In terms of the
metacognition theme of ASCEND, asking groups to
start by making a prediction encourages them to
make their initial thinking explicit, as preparation
for later judging their predictions. Careful observations
and measurements are needed to collect data that
would allow the patterns to be recognised.
There is an instruction sheet for each of the three
experiments (a term which is probably valid in this
practical work, as it is unlikely students will
already know what will happen). |
| |
| Identifying patterns
– cooling |
| |
“Everyone knows that
‘hot objects cool down’, but does this always happen?”
This sheet begins with some familiar background
which emphasises that heat only flows away from
an object whilst it is hotter that its surroundings
(the ‘ambient’ temperature). The students are invited
to boil some water, and leave it in a clamped test-tube.
They are asked to “Make a prediction: how do you
think the temperature will change during cooling?”
and then “Check out your prediction”. After collecting
data they are asked “Can you identify a pattern
in the way that the temperature of the water changes
during cooling?” and “Can you suggest an explanation
for any pattern that you find?”.
Details of exactly how much water to use, and how
often to take measurements, are deliberately omitted.
In real enquiry a mixture of intelligent guesswork
(physical intuition?) and trial-and-error provides
guidance. Similarly students are not told to repeat
their measurements of how to judge whether they
have reliable results. These are matters that gifted
learners should be able to debate in their groups.
It is very important that students have enough time
to ‘play’ (safely and productively!) with these
practical activities in this session. |
| |
| Identifying patterns
– water flowing downhill |
| |
“We all know that water
flows downhill – but what determines how quickly
water runs downhill?” The instructions here follow
a similar pattern to the cooling experiment. The
students are informed that “you are provided with
apparatus that enables you to model the effects
of water flowing down hill. The two glass tubes
[burettes are suitable] are connected by flexible
tubing, with a tap to stop or start water flow.
You can change the difference in the height of the
water in the two tubes by adjusting the clamps.”
The students are invited to “Make a prediction:
What do you think will happen if you set up the
apparatus so that the water in each tube is at the
same height, and open the tap?” and to “Check out
your prediction.” (It is expected this will be a
simple question for students, but it does put the
focus on difference in water levels.) The group
are asked “Can you identify a pattern in the water
flow rate? Set up the apparatus to give as big a
difference in water height as possible, and then
open the tap to allow water to flow. See if you
can identify a pattern in the rate at which the
water flows from one tube to the other.” When they
have collected data the group are invited to “suggest
an explanation for any pattern that you find?” |
| |
| Identifying patterns
– capacitor discharge |
| |
The third experiment
is slightly different as it is expected that capacitors
will not be familiar to many students. The instruction
for this experiment therefore includes a little
more background on the capacitor concept: “A capacitor
is an electrical component that is used in some
circuits to store charge. The capacitor can be charged
by connecting it to a suitable power supply. If
the charged capacitor is then connected into a suitable
circuit it will discharge. The potential difference
(p.d., voltage) across the capacitor ‘plates’ (ends)
will generate a current through the circuit. As
charge moves away from the capacitor plates the
p.d. across the capacitor will drop. Eventually,
if the capacitor becomes completely discharged,
then it will no longer be able to provide a current.”
The students are told that “the apparatus provided
enables the capacitor to be charged quickly, and
(by changing the position of the switch) to be discharged
through a resistor. The voltmeter shows the p.d.
across the capacitor at any time, and the ammeter
shows the current during discharge.” The students
are asked to “make a prediction: do you think the
current will have a steady value during discharge?”
before they “check out your prediction”. Similar
to the two other experiments, the groups are asked
“can you identify a pattern in the current values
during discharge?” and “can you suggest an explanation
for any pattern that you find?” |
| |
G:
‘if the capacitor’s releasing current that’s
why if goes down faster at the beginning,
cos it’s more efficient. As it begins to
run out of charge it . . . goes slower and
that’s what I’m trying to understand . .
.’
B: ‘so when it’s fully charged it’s releasing
lots fast but then it loses more charge
which means . . . which means that it must
slow down . . . which means that it then
loses less charge than before which means
that it keeps slowing down . . .’
G: ‘. . . so basically it’s the half-life
thing . . .’ …
B: ‘. . . current going out . . . so like
. . . makes the total current get less which
means that there’s less current going out’
(Dialogue during the capacitor discharge
task (the students do not seem to discriminate
current from charge but seem to be feeling
towards the key ideas))
|
|
| |
| The practical activities
offer a chance to find evidence for laws, whilst
the accompanying information sheets offer an opportunity
to link law (i.e. observed regularities in nature)
with theoretical models. |
| |
| Support for students’
developing thinking |
| |
| Two types of support
material are provided for students. Information
is provided on laws in science (complementing
the sheet provided during the explanations activity),
to be distributed near the start of the session,
and some material introducing ‘systems’ is provided
which relates to the particular common type of pattern
being explored in the three experiments (i.e. exponential
decay). Teachers should use their judgement in deciding
when to introduce this, and ‘differentiation by
support’ (see Chapter 3) may be appropriate. |
| |
| Laws in science |
| |
The information sheet
provides information about laws (“a regular
pattern that has been observed, and which it
believed to be a reliable finding, i.e. something
that always happens”…which are often “described
in terms of mathematical relationships”), and compares
them with facts (“that refer to specific examples”);
principles and theories.
The information sheet also gives brief accounts
of laws that may be met in school science: Hooke’s
law; Ohm’s law; Boyle’s law; Charles’ law; the pressure
law; The periodic law; Coulomb’s law |
| |
| Systems with feedback |
| |
| The second set of supporting
information |
| |
•
introduces a simple formalism (model)
for representing feedback cycles;
• distinguishes positive and negative
feedback;
• relates this to simple examples (audio
(positive) feedback and thermostatic control);
• then introduces more complex examples
(positive feedback in global warming,
and then a possible negative feedback
complication). |
|
| |
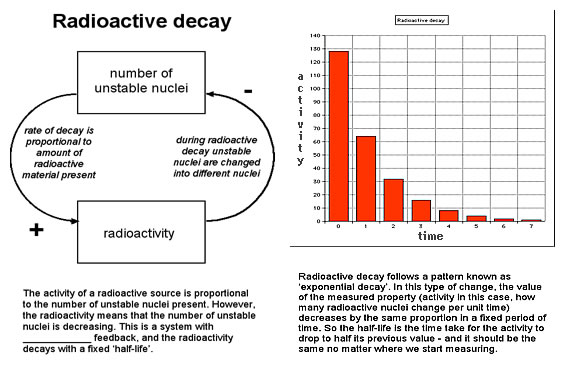
| Two examples of positive feedback
relating to learning are introduced (reinforcing
material in a previous session, i.e. Activity 3),
and the example of radioactivity is introduced,
including the general nature of the decay curve,
potentially acting as a model for the three analogous
decay phenomena in the practical activities. |
| |
|
|
| The first set of diagrams
introduces a model feedback loop, and the distinction
between positive and negative feedback. The next
two diagrams offer simple examples of positive and
negative feedback. |
| |
|
| |
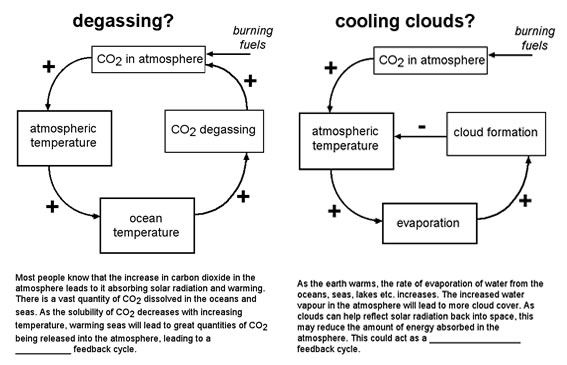
| The next two diagrams offer slightly
more complex examples from environmental science.
These show the positive feedback cycle by which
global warming releases more carbon dioxide from
the oceans, and the potential off-setting of global
warming by the potential of increased cloud cover
to reflect more radiation back into space. These
examples reflect something of the complexity and
uncertainly of science: features that should appeal
to many gifted learners. |
| |
|
|
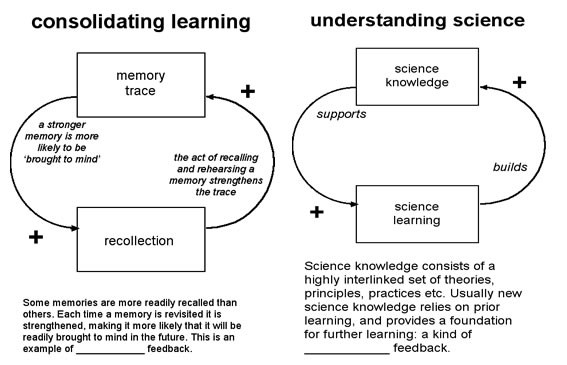
| Another two examples
relate to learning: providing review of ideas met
in the earlier ASCEND session on learning science,
and linking the nature of science to the nature
of learning: where existing understanding supports
new learning, which can itself reinforce previous
learning. |
| |
|
| |
| The final example given
in the support materials concerns radioactive decay,
which provides a strong analogy to the
three examples explored in the laboratory. A simple
graph representing exponential decay is also included.
This can provide a comparison with the findings
from the laboratory. This provides additional scaffolding:
if these experiments give the same type of patterns,
could they be represented by a similar feedback
cycle? Teachers may decide to withhold these sheets
until later in the session, and release them if/when
group have either come to a view on what is going
on, or if they are making little progress in their
deliberations. (Alternatively, if time is limited,
the laboratory session could be followed up an exploration
of feedback systems in a subsequent session.) |
| |
|
| |
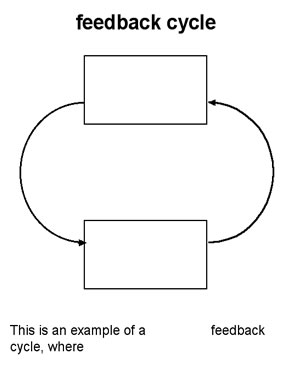 Figure 5.1: Blank feedback
cycle diagram for students to complete
Figure 5.1: Blank feedback
cycle diagram for students to complete
|
| |
This ASCEND activity
is unlike some of the others in having a key ‘target’
outcome. The students are asked to identify the
three experiments as involving a similar pattern,
and recognise that it resembles that in radioactive
decay. They should be encouraged to describe the
cooling, water flow and capacitor discharge as negative
feedback, making the connection that these analogous
situations lead to similar patterns (exponential
decay) because in each case some kind of driver
(temperature difference; head of water; potential
difference) leads to some kind of flow (heat; fluid;
current) which is both proportional to the magnitude
of the driver, and leads to a reduction in that
magnitude.
Any student who without help recognises that the
feedback process means that not only does the flow
diminish because the driver is reduced, but as the
flow diminishes the rate of reduction in the magnitude
of the driver decreases, leading to a reduction
in rate at which flow decreases,… has grasped the
abstract principle behind the ‘law’ of exponential
decay, and surely deserves the label gifted! |
| |
| Debriefing points: |
| |
| There are many potential
teaching points arising from this session. It is
suggested that teachers might wish to highlight
the following: |
| |
•
Identifying laws requires good data
sets (this is likely to be clear from
the results of different groups!)
• Apparently diverse phenomena may
show similar patterns, which may (note
– is not necessarily) due to similar
underlying causes
• Many phenomena that interest scientists
are complex, and need to be examined
as systems, not isolated features
|
|
|
| |
| Resources |
| |
| The session needs a
laboratory, and suitable apparatus to fit the instructions
provided. (Instructions for students are included
on the CDR, but these may be adapted to local conditions.)
The three activities are: |
| |
• Cooling – heated water cooling
towards room temperature.
• Capacitor circuit allowing quick
charging, and slower discharge.
(This is the standard set up for
quick charging of a capacitor, followed
by discharge through a resistor.
CR should be chosen to be of the
order of a minute or so.)
• Water flowing between two burettes
connected by rubber tubing with
a releasable clamp, and supported
in such a way that the ‘head of
water’ (difference in levels between
the burettes) can be easily changed.
|
|
|
| |
Ideally, each group of students has
access to a full set of apparatus, and is able to
plan their approach to tackling the tasks (the order,
dividing into sub-groups working on different activities
etc.) allowing the opportunity to revisit each activity
as indicated by their developing notions of what
they are finding.
The three activities each present a physical situation
where the driver (temperature difference, p.d.,
head of water) leads to a flow (of heat, current,
water) that reduces the magnitude of the driver,
so that the flow reduces, so reducing rate at which
the magnitude of the driver diminishes, so that…
(see above).
In other words there is the pattern of an exponential
decay, which can be explained due to a negative
feedback cycle (temperature difference causes heat
flow, which reduces temperature difference, etc.)
Students are provided with some reference materials
about laws in science, and about feedback cycles
(using examples from other areas of science). One
of the examples used in the materials is radioactive
decay, and a decay curve is included that has a
similar form to those potentially uncovered in the
three practical activities (see above). |
| |
| The following resources
are included on the CD: |
| |
| Resource |
Description |
Filename |
| Laws |
Some
introductory information on ‘Laws
in science’ and ‘Some examples
of laws in science’ |
Act
5 Laws |
| Feedback |
A
series of figures illustrating
feedback, and feedback cycles
in principle, and in terms of
specific examples. |
Act
5 Systems |
| Identifying
patterns |
Instructions
for the three practical activities |
Act
5 Instructions |
|
|
|
| |
| Download
PDF of activity 5 brief |
| |
|